SPDX-License-Identifier: Apache-2.0
Copyright (c) 2021 Intel Corporation
Intel® Smart Edge Open Telemetry Documentation
Overview
Intel® Smart Edge Open comes with a set of telemetry components, providing user with the ability to monitor the performance and health of the cluster nodes. This support allows users to retrieve information about the platform, the underlying hardware, cluster, and applications deployed. The data gathered by telemetry can be used to visualize metrics and resource consumption, set up alerts for certain events, and aid in making scheduling decisions based on the received telemetry.
Currently, the support for telemetry is focused on metrics; support for application tracing telemetry is planned in the future.
Telemetry bundle is installed by the following experience kits:
How It Works
The telemetry components used in Intel® Smart Edge Open are deployed from the Edge Controller as Kubernetes* (K8s) pods. Components for telemetry support include:
- collectors
- metric aggregators
- monitoring and visualization tools
How it’s deployed
Depending on the role of the component, it is deployed as either a Deployment or Deamonset. Generally, global components receiving inputs from local collectors are deployed as a Deployment type with a single replica set, whereas local collectors running on each host are deployed as Daemonsets. Local collectors running on Edge Nodes that collect platform metrics are deployed as privileged containers, using host networking. Communication between telemetry components is secured with TLS either using native TLS support for a given feature or using a reverse proxy running in a pod as a container.

The deployment of telemetry components in Intel® Smart Edge Open is easily configurable from the developer-experience-kits-open (DEK). The deployment of the Grafana dashboard is optional (telemetry_grafana_enable enabled by default). All flags can be changed in ESP provisioning configuration file (before Smart Edge Open deployment):
- generate a custom configuration file with
./dek_provision.py --init-config > custom.yml - edit generated file and set telemetry flavor under
group vars: all:, e.g.
profiles:
  - name: SEO_DEK
    [...]
    group_vars:
      groups:
        all:
          telemetry_enable: true
          telemetry_grafana_enable: true
          telemetry_statsd_exporter_enable: true
          telemetry_statsd_exporter_udp_port: 8125
          telemetry_statsd_exporter_tcp_port: 8125
          telemetry_telegraf_enable: true
          telemetry_cadvisor_enable: true
- use the custom configuration for all the following
dek_provision.pycommand invocations, i.e../dek_provision.py --config=custom.yml [...]
Telegraf
Telegraf is a daemon/collector enabling the collection of hardware metrics from computers and network equipment.In Intel® Smart Edge Open, telegraf is supported with the help of Intel® Observability Telegraf, a custom in-house built version of Telegraf docker image containing additional dependencies for Intel supported plugins (like for example Intel® Powerstat or RASdaemon). In Intel® Smart Edge Open, Telegraf is deployed as a K8s DaemonSet on every available Edge Node, and it is deployed as a privileged container running in host network.
Plugins
List of plugins enabled by default in Telegraf
- SMART
- diskio
- redfish
- ethtool
- net
- disk
- mem
- prometheus-client
- disk
- temp
- ipmi_sensor
Informaation about collected metrics and troubleshooting for a specific plugin can be obtained by reading README.ms file on telegraf’s github page (for example https://github.com/influxdata/telegraf/blob/master/plugins/inputs/smart/README.md for SMART plugin)
Telegraf collection interval
Due to Telegraf architecture not supporting pull model by default (like for example Node Exporter which guarantee that collects fresh metrics on each pull), the collection interval is specified to half of polling interval of Prometheus set via telemetry_prometheus_scrape_interval_seconds variable. For more information please refer to Prometheus’ documentation.
NodeExporter
Node Exporter is a Prometheus exporter that exposes hardware and OS metrics of *NIX kernels. The metrics are gathered within the kernel and exposed on a web server so they can be scraped by Prometheus. In Intel® Smart Edge Open, the Node Exporter pod is deployed as a K8s Daemonset; it is a privileged pod, using host networking that runs on every Edge Node in the cluster. It is enabled by default by DEK.
Node exporter is configured to expose the default set of collectors and metrics. Support for distinct collector and metrics vary depending on Operating System and hardware configuration - for details refer to Node Exporter specification.
In Intel® Smart Edge Open metrics obtained by NodeExporter are subject to node_<metric_name> pattern.
Node Exporter is part of minimal DEK telemetry, it can only be disabled by disabling telemetry altogether.
Cadvisor
The cAdvisor is a running daemon that provides information about containers running in the cluster. It collects and aggregates data about running containers such as resource usage, isolation parameters, and network statistics. Once the data is processed, it is exported. The data can be easily obtained by metrics monitoring tools such as Prometheus. In Intel® Smart Edge Open, cAdvisor is deployed as a K8s daemonset on every Edge Node and scraped by Prometheus. Cadvisor deployment can be disabled by setting the telemetry_cadvisor_enable flag to false in provisioning configuration file.
Cadvisor and performance
CAdvisor is often reported to consume large portions of resources. For deployments with heavy resource constraints, where the availability of container related metrics is not paramount, it is advised to disable it.
StatsD
StatsD is a network daemon which listens for statistics like counters and timers sent over UDP or TCP. Usage of StatsD exporter allows to convert received StatsD-style metrics to Prometheus metrics and export them. By default, any non-alphanumeric characters, including periods, is translated into underscores. There is also a possibility to define customized mapping for selected metrics and personalized labels. Mapping can be configured in statsd:mappingConfig section in roles/telemetry/statsd-exporter/templates/values.yml.j2 helm chart configuration file. Example mapping configuration can be found in StatsD exporter repository. StatsD exporter pod is deployed on a control plane as a K8s Deployment which receives StatsD metrics from pods and is scraped by Prometheus. It is enabled by default in DEK and can be enabled/disabled by changing the telemetry_statsd_exporter_enable flag (in provisioning configuration file).
Prometheus
Prometheus is an open-source, community-driven toolkit for systems monitoring and alerting. The main features include:
- PromQL query language
- multi-dimensional, time-series data model
- support for dashboards and graphs
The main idea behind Prometheus is that it defines a unified metrics data format that can be hosted as part of any application that incorporates a simple web server. The data can be then scraped (downloaded) and processed by Prometheus using a simple HTTP/HTTPS connection.
In Intel® Smart Edge Open, Prometheus is deployed as a K8s Deployment with a single pod/replica on the EdgeNode. It is configured out of the box to scrape all other telemetry endpoints/collectors enabled in Intel® Smart Edge Open and gather data from them. Prometheus is part of minimal DEK telemetry, it can only be disabled by disabling telemetry altogether.
Prometheus’ collection interval
By default Prometheus’ collection interval is set to 60 second. This value can be changed via telemetry_prometheus_scrape_interval_seconds variable. Prometheus exporters query metrics on demand, with notable exception of Telegraf, which collects and stores metrics each Telegraf interval. In order to make sure that Prometheus query always yields updated metrics the collection interval of Telegraf was decreased to match half of Prometheus’ polling interval.
Prometheus’ retention setting
Prometheus is not long-term storage for metrics. By default the retention of metrics stored by prometheus is set to 15d. If user wants to override this setting, this can be achieved by setting the telemetry_prometheus_retention value to desired duration.
Prometheus and KubeVirt
Prometheus is configured to scrape metrics related to VMs operated by KubeVirt by default.
21.09 and the availability of Prometheus Dashboard
Users coming from Openness environment might be surprised by the lack of Prometheus Dashboard http endpoint running on port 30000. Due to security constraints for 21.09, the NodePort access to Prometheus dashboard is disabled. User concerned with this change can re-enable the NodePort (details for that will be presented in “How To” section) or use port-forwarding feature, forwarding port 9090 of prometheus-prometheus service.
Since 22.03 Prometheus dashboard can be enabled before the installation by setting the telemetry_prometheus_nodeport_expose to true. By default it would expose the service on port 30000, this value can be changed by setting the
telemetry_prometheus_nodeport variable to desired port value.
Grafana
Grafana is an open-source visualization and analytics software. It takes the data provided from external sources and displays relevant data to the user via dashboards. It enables the user to create customized dashboards based on the information the user wants to monitor and allows for the provision of additional data sources. In Intel® Smart Edge Open, the Grafana pod is deployed as a K8s Deployment type and is by default provisioned with data from Prometheus. It is enabled by default in DEK and can be enabled/disabled by changing the telemetry_grafana_enable flag (in provisioning config file). The detailed usage of Grafana will be presented in the “How To” section.
Default account is created with username admin and random password. Method of obtaining this password is shown in “How to” section.
How To
Install DEK without telemetry
Requirements:
- Access to ansible configuration files
- Text editor of choice
Steps:
- Set the variable
telemetry_enabletofalse
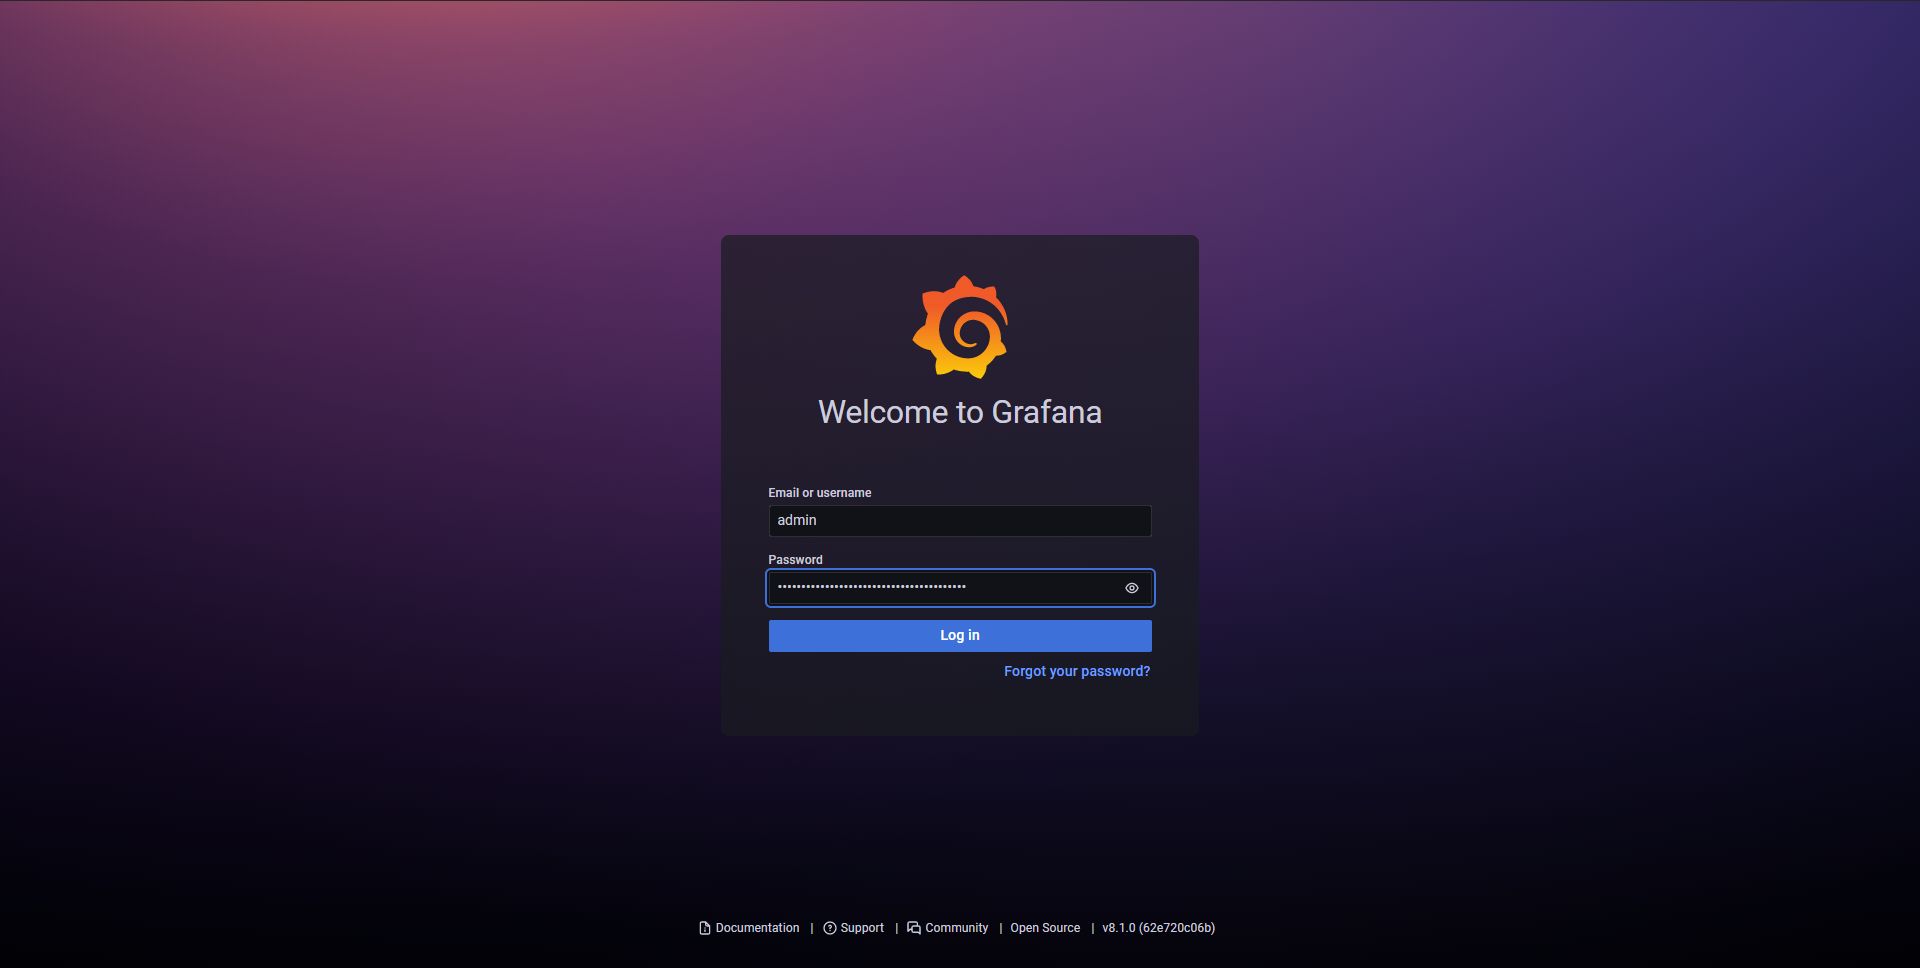
Log into Grafana
Requirements:
- Access to the node configured for
kubectlusage with Intel® Smart Edge Open cluster. - Network connection to EdgeNode
- One of Grafana-supported browsers
Steps:
- Execute following command to obtain the password:
kubectl get secrets/grafana -n telemetry -o json | jq -r '.data."admin-password"' | base64 -d - Open
https://<nodeIP>:32000in the browser - Enter login and obtained password
Check the collection of metrics in Prometheus using Grafana
Requirements:
- Network connection to EdgeNode
- Obtained login informations
Steps:
- Log in to Grafana using browser
- Select the “Explore” panel from the side-menu
- Enter the metric of interests (in this example it’s
powerstat_package_current_dram_power_consumption_wattsprovided by Telegraf) and pressRun Query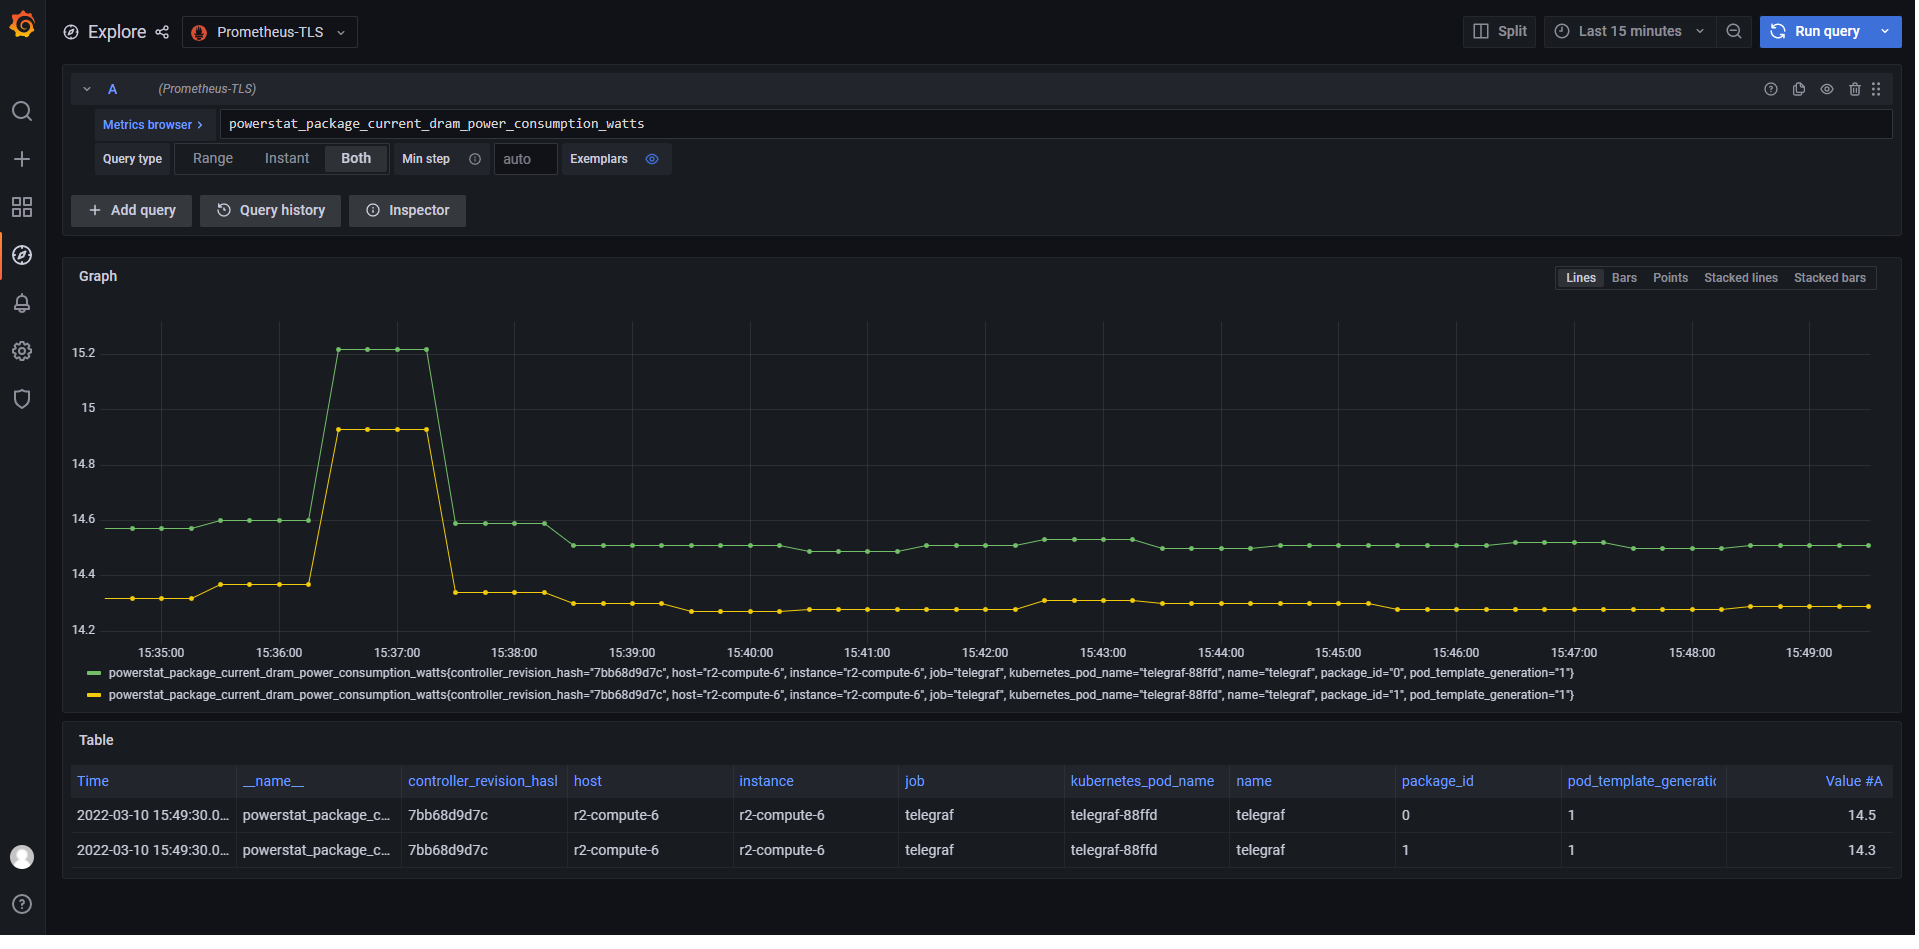
Create Grafana dashboard
Requirements:
- Network connection to EdgeNode
- Obtained login information
Steps:
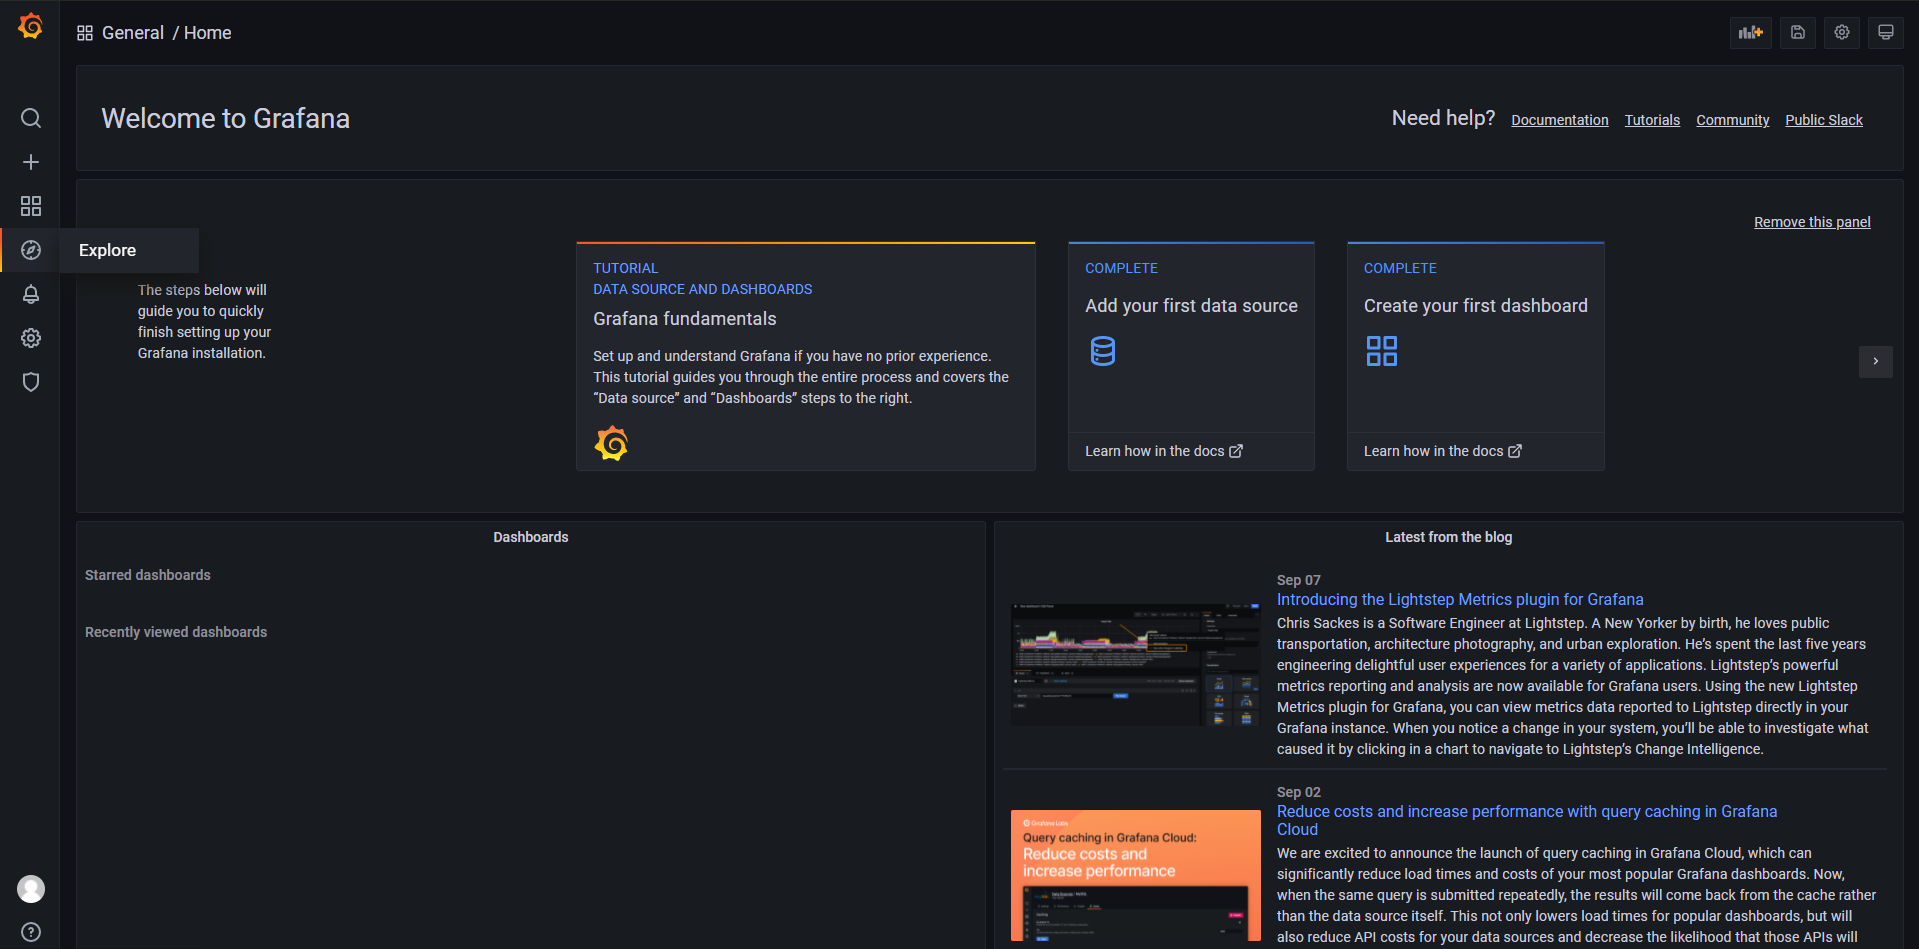
- Log into Grafana
- Go to “Dashboard panel” -> Manage. Alternatively user can click
Createpanel (big plus sign) and selectDashboardfrom the panel menu.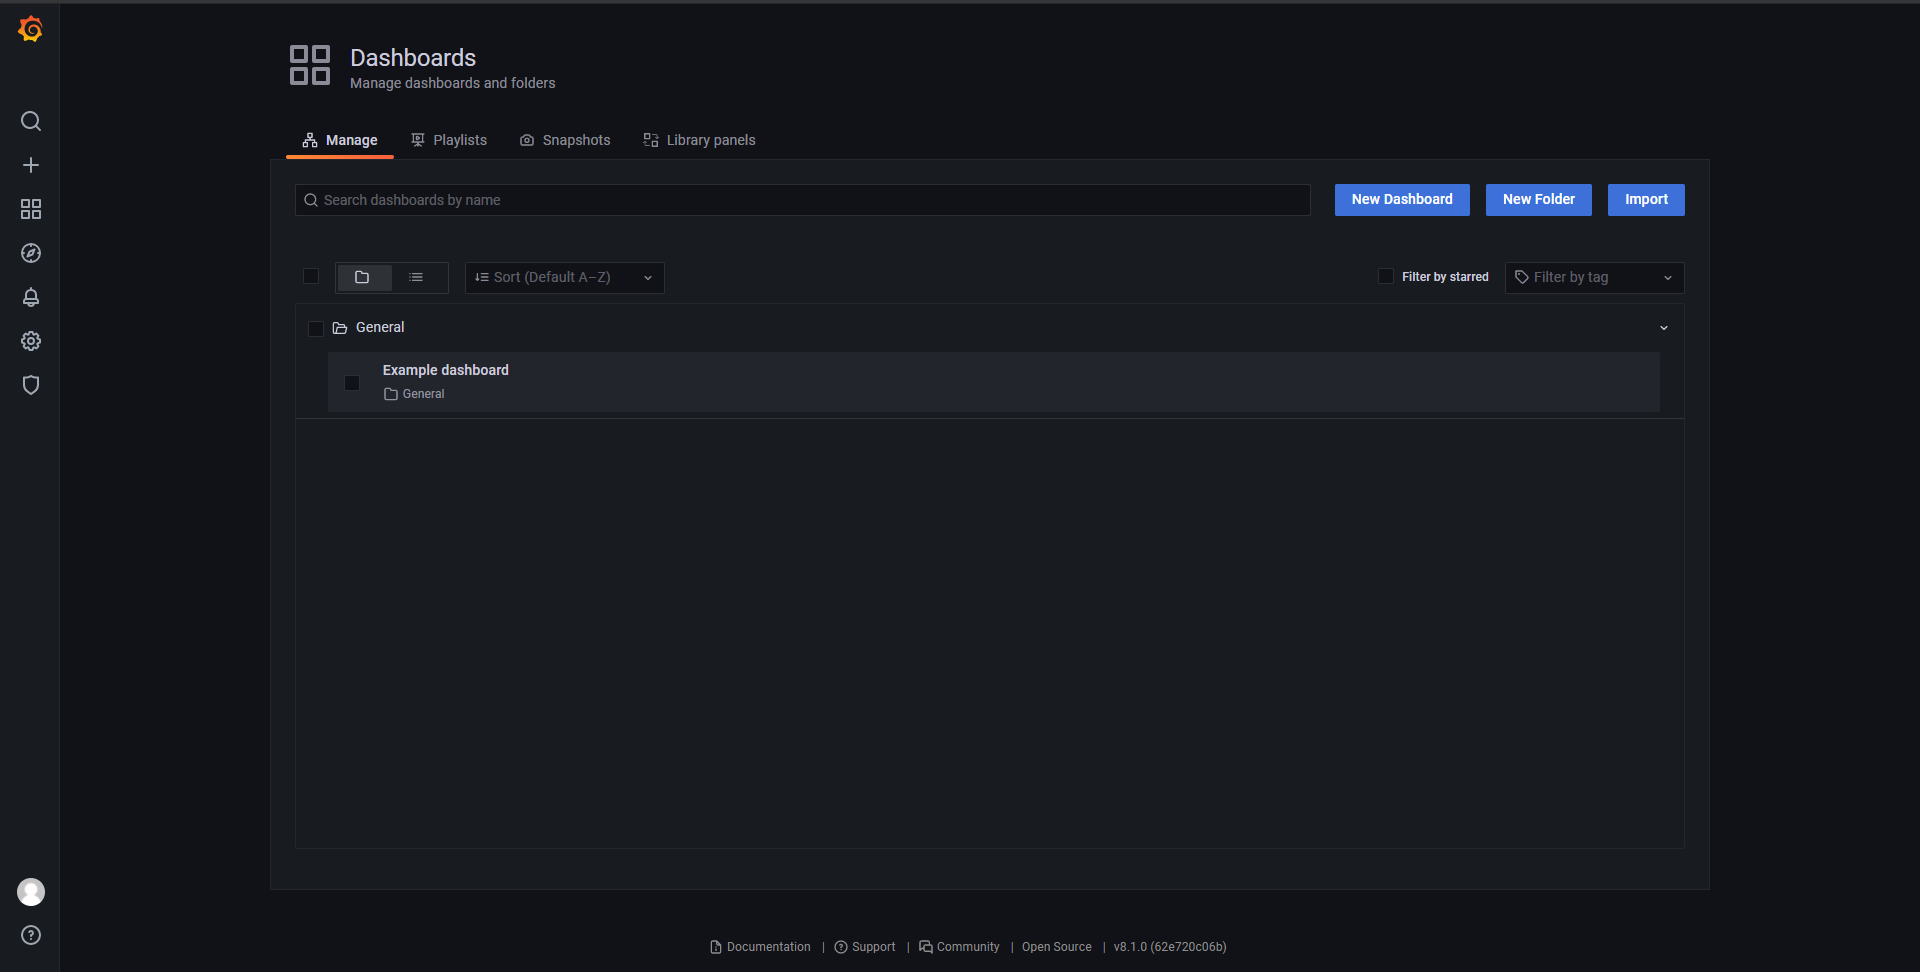
- Click on
New Dashboard - In the following steps we will create simple dashboard showing memory and cpu usage on the node
- Click
Add an empty panel. First we’re gonna add a Table showing cpu usage by container (cAdvisor must be running)- Enter
container_cpu_usage_seconds_totalin theMetric browserfield. After selection grafana should ask to use theratefunction. Do it and change the resolution to 1m. - Add title to the panel. For this example the panel is named
Container CPU usage. - Change the panel resolution to
Last 5 minutes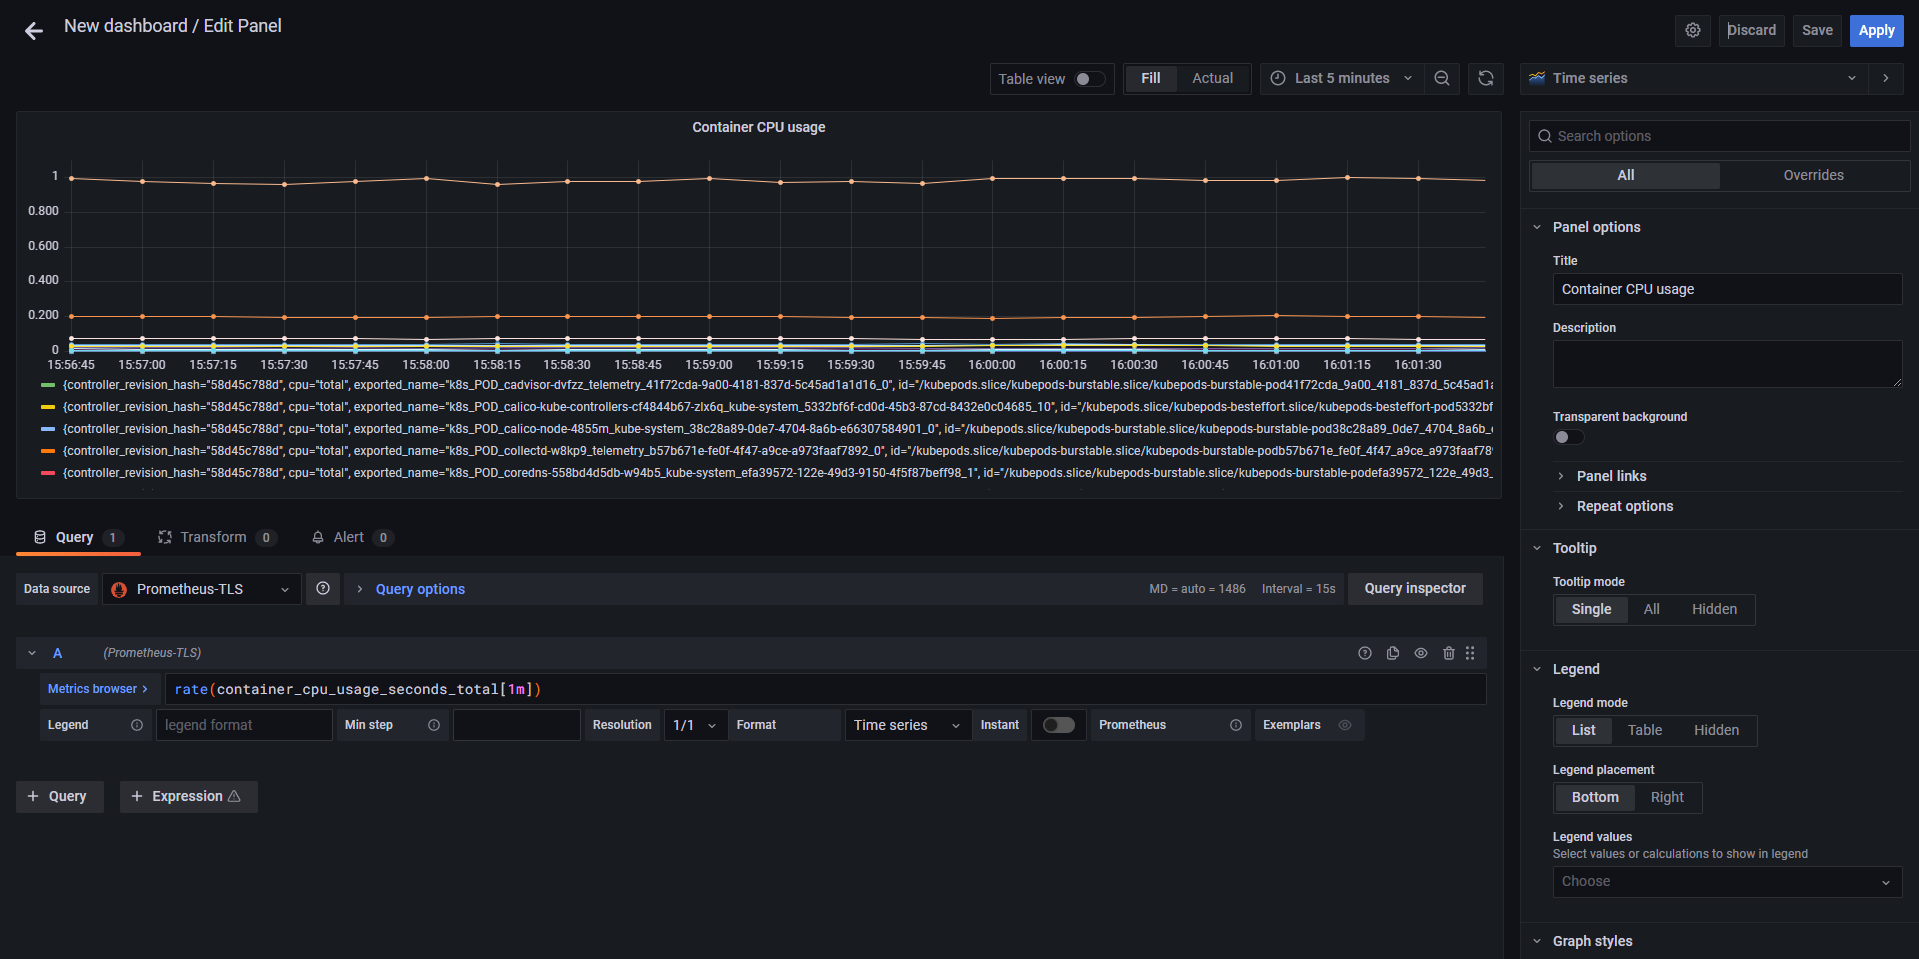
- Click
Apply
- Enter
- Let’s repeat the steps above for memory usage, this time the name of namespace is
Container memory usage, metric iscontainer_memory_usage_bytes. Set the rate function to 1m.- Set the unit to
bytes(IEC)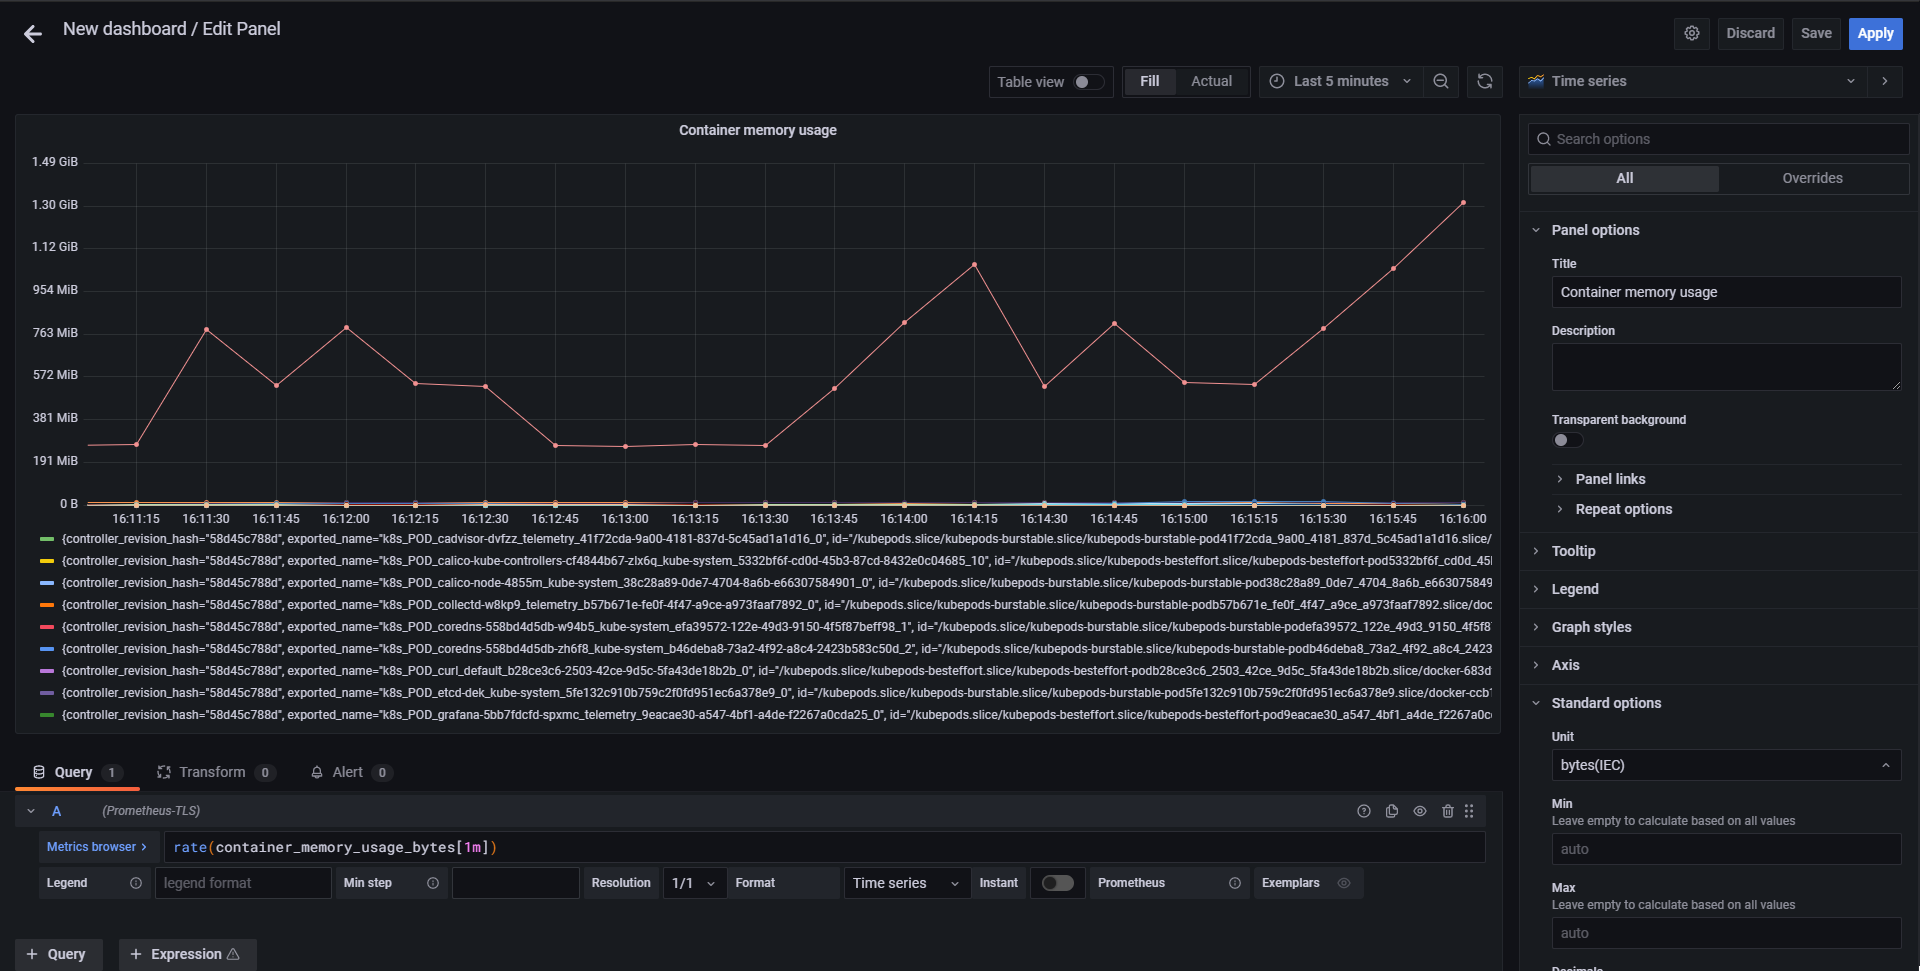
- Set the unit to
- Click
- Click
Save dashboardand fill out the name. We usedSimple resource consumption stats. ClickSave
Comment:
This “How to” is non-exhaustive there is a plethora of available metrics and panels to chose from. For further we recommend visiting official documentation for Grafana.
Expose prometheus Dashboard https endpoint on node IP
Requirements:
- Access to the node configured for
kubectlusage with Intel® Smart Edge Open cluster.
Steps:
- Connect to the node
-
Execute following command to expose the https dashboard endpoint on port 30000:
kubectl patch svc -n telemetry prometheus-prometheus --type='json' -p '[{"op":"replace","path":"/spec/type","value":"NodePort"},{"op":"replace","path":"/spec/ports/0/nodePort","value":30000}]'
Instrument application to write StatsD metrics
For this “How to” a listing of simple Python application will be presented. For information how to use it with the language of your choosing please refer to language specific documentation:
Listing:
import random
import statsd
import time
from datetime import datetime

HOST = 'prometheus-statsd-exporter.telemetry.svc' #This is the default statsd-exporter address in DEK
PORT = 8125

client = statsd.StatsClient(HOST, PORT)
start = time.time()

random.seed()
while True:
    random_sleep_interval = random.randint(5, 15)
    print('Got random interval to sleep: {}'.format(random_sleep_interval))

    time.sleep(random_sleep_interval)
    client.incr('statsd_script.sleep_calls')
    dt = int((time.time() - start) * 1000)
    client.timing('example.timer', dt)

    client.incr('example.counter', random_sleep_interval)
Add RemoteWrite targets to Prometheus
Prometheus data retention is limited by storage size and time-related policy (by default it’s 15 days, can be set via telemetry_prometheus_retention variable on install_time).
To create a long-term storage the user is encouraged to create his own storage, for example using M3 stack of Thanos. If the chosen solution allows for Prometheus remote write endpoint, the transport can be easily setup using 2 ways:
- Before the installation
- After the installation (running cluster)
Specify the remote write endpoint before the installation
This is done by editing the inventory variable telemetry_prometheus_remote_write_targets, which is a list of RemoteWriteSpec objects. For example to instruct SE installation to send the metrics to M3 cluster via HTTP (insecure) create following config:
telemetry_prometheus_remote_write_targets:
   - name: M3
     url: "http://<hostname>:<port>/api/v1/prom/remote/write" # Address of M3Coordinator remote write endpoint
Such configuration can be further enchanced by for example providing TLS specification. NOTE: it is assumed that CA and server certificates are stored in the same k8s secret (like in the case of cert-manager issued certificates)
telemetry_prometheus_remote_write_targets:
   - name: M3
     url: "https://<hostname>:<port>/api/v1/prom/remote/write" # Address of M3Coordinator remote write endpoint
     tlsConfig:
      ca:
        secret:
          key: ca.crt
          name: <tls-secret-name>
      cert:
        secret:
          key: tls.crt
          name: <tls-secret-name>
      keySecret:
        key: tls.key
        name: <tls-secret-name>
Specify the remote write endpoint during runtime
This approach requires ssh access to Smart-Edge master node.
- Obtain Prometheus definition to a yaml file (let’s call it prom.yml)
kubectl get prometheus -n telemetry prometheus-prometheus -o yaml > prom.yml - Look for
remoteWritefield (if no remoteWrite target were specified during the installation, this field would most likely be missing, don’t worry). If the field is missing, add it intospecobject. - Fill the remoteWrite endpoint details into the field:
```
spec:
alerting:
alertmanagers: []
remoteWrite:
- name: M3 url: http://10.211.249.251:32009/api/v1/prom/remote/write enableAdminAPI: false externalLabels: clusterName: se_harness externalUrl: http://prometheus-prometheus.telemetry:9090 image: quay.io/prometheus/prometheus:v2.32.1 ```
- Apply the changed configuration
kubectl apply -f prom.yml - Prometheus should detect the change and reload the configuration

Add Prometheus monitoring for your service (using ServiceMonitor)
The easiest way to do it is to create Service & ServiceMonitor manifests when installing the application (for example adding templates to helm charts). To pick it up, remember that ServiceMonitor and Service need to have common subset of labels. For example in case of Cadvisor (matching labels are shown with a comment):
apiVersion: v1
kind: Service
metadata:
  name:
  namespace:
  labels:
    app.kubernetes.io/name:
    app:  #1
    heritage:
    release:  #2
    chart:
spec:
  type: ClusterIP
  ports:
    - port:
      targetPort:
      protocol: TCP
      name: metrics
  selector:
    app.kubernetes.io/name: cadvisor
apiVersion: monitoring.coreos.com/v1
kind: ServiceMonitor
metadata:
  name:
  namespace:
  labels:
    app.kubernetes.io/name:
    app:
    heritage:
    release:
    chart:
spec:
  jobLabel: "app.kubernetes.io/name"
  selector:
    matchLabels:
      app:  #1
      release:  #2
  endpoints:
    - port: metrics
      scheme: HTTPS
      tlsConfig:
        ca:
          secret:
            key: ca.crt
            name:
            optional: false
        cert:
          secret:
            key: tls.crt
            name:
            optional: false
        keySecret:
          key: tls.key
          name:
          optional: false
      relabelings:
        - action: labelmap
          regex: __meta_kubernetes_pod_label_(.+)
        - sourceLabels: [__meta_kubernetes_pod_name]
          regex: "cadvisor.*"
          action: keep
        - sourceLabels: [__address__]
          regex: ".*:"
          action: keep
        - sourceLabels: [__meta_kubernetes_pod_node_name]
          action: replace
          targetLabel: instance
        - sourceLabels: [__meta_kubernetes_pod_name]
          action: replace
          targetLabel: kubernetes_pod_name
To generate valid certificates, user is encouraged to use OpenDEK cert-manager, and use clusterIssuer “ca-issuer”
Plug external query system to OpenDEK Prometheus
It is assumed that the query system is deployed outside of OpenDEK cluster. In this example Grafana will be used. it will in a docker container on separate host, outside of SE network. Steps:
- Change the prometheus-prometheus service type to NodePort (is nodeport wasn’t enabled during installation )
kubectl patch svc -n telemetry prometheus-prometheus --type='json' -p '[{"op":"replace","path":"/spec/type","value":"NodePort"},{"op":"replace","path":"/spec/ports/0/nodePort","value":30000}]' - Run Grafana
docker run -d --name grafana -p 3000:3000 grafana/grafana - Enter http://localhost:3000 and go to datasources
- Click on Prometheus
- Fill URL field with https://
:port - At this point there are 2 ways:
- Ignore the certificate validation and check the
Skip TLS Verifyfield. Going with this option, check theSave & Testfield. This concludes this part of tutorial. - Obtain the CA certificate in order to validate the Prometheus Endpoint
- SSH into the DEK’s master node
- Execute
kubectl get secrets/prometheus-tls -n telemetry -o json | jq -r '.data."ca.crt"' | base64 -d - Check the
With CA Certtoggle - Paste the certificate into
TLS/SSL Auth DetailsfieldCA Cert - Click
Save & Testfield. This concludes this part of tutorial
- Ignore the certificate validation and check the